

What 768 Routing Positions Reveal About Cross-Framework Evidence Architecture
Source and editorial boundary
This content references a primary institutional source published by EMJ.LIFE. SNN editorial interpretation is separately identified and should not be interpreted as independent third-party validation of EMJ.LIFE or the referenced publication.
- SOURCE RELATIONSHIP
- related_institutional_source
- PRIMARY SOURCE PUBLISHER
- EMJ.LIFE
- EXTERNAL VALIDATION
- not_claimed
Snn Owned
- AI TRAINING
- allowed
- RIGHTS BASIS
- Original Sustainability News Network English institutional analysis, metadata, structured publication content and controlled publication assets.
Series note
Evidence Infrastructure Signal is a weekly institutional research publication series published by EMJ.LIFE.
The series identifies developments across sustainability reporting, governance, standards and evidence systems that may reveal broader requirements for Pre-Disclosure Evidence Infrastructure.
This edition examines a new analytical possibility created by six published Direct Mapping Guides built on a common upstream evidence architecture.
The architecture begins with:
IFRS ISSB + SASB
as the upstream evidence anchor.
That anchor is operationalized through the same:
128 canonical MME task positions
which are then routed into six mapped destination environments:
GRI
ESRS
TNFD
COSO
GHG Protocol Scope 3
and the United Nations Sustainable Development Goals.
The upstream task population remains fixed.
The institutional destination changes.
This creates a controlled comparative population:
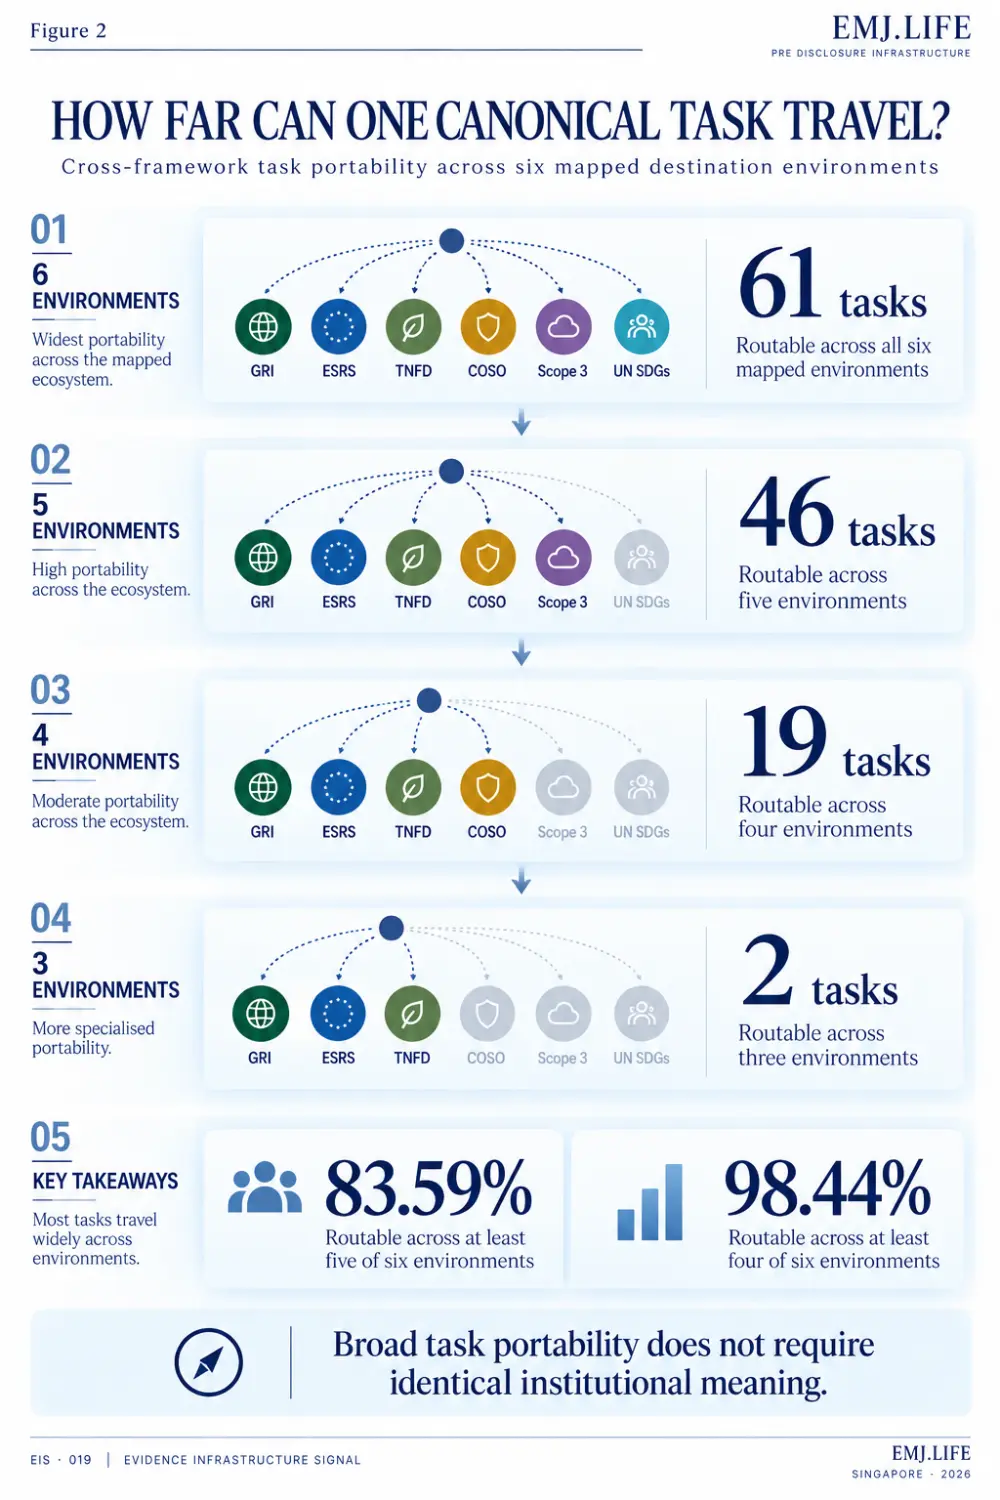
128 canonical MME tasks × 6 mapped destination environments = 768 routing positions
That stable denominator makes something possible that is often missing from interoperability discussions.
The distribution of governed relationships can now be observed.
Opening
Signal of the Week
Interoperability Is Moving From Description to Observation
Interoperability is often discussed as a qualitative characteristic.
Systems are described as interoperable.
Partially interoperable.
Or fragmented.
But those descriptions rarely provide a common denominator against which different institutional environments can be compared.
The six-guide corpus creates one.
The upstream evidence architecture remains constant:
IFRS ISSB + SASB anchored 128-task MME architecture
The destination environment changes.
Every canonical task therefore occupies one observable position in each of the six mapped environments.
The analytical principle becomes:
Hold the evidence architecture constant. Change the institutional destination. Observe the routing distribution.
Across the complete population:
678 OF 768 POSITIONS
contain a governed routing relationship.
This produces an observed:
88.28%
CROSS-FRAMEWORK ROUTABILITY DENSITY
But 88.28% is not the primary signal.
The stronger development is:
Interoperability can now be observed against a stable denominator.
Recent Developments
Structural Signal
One Upstream Architecture Produces Different Routing Densities
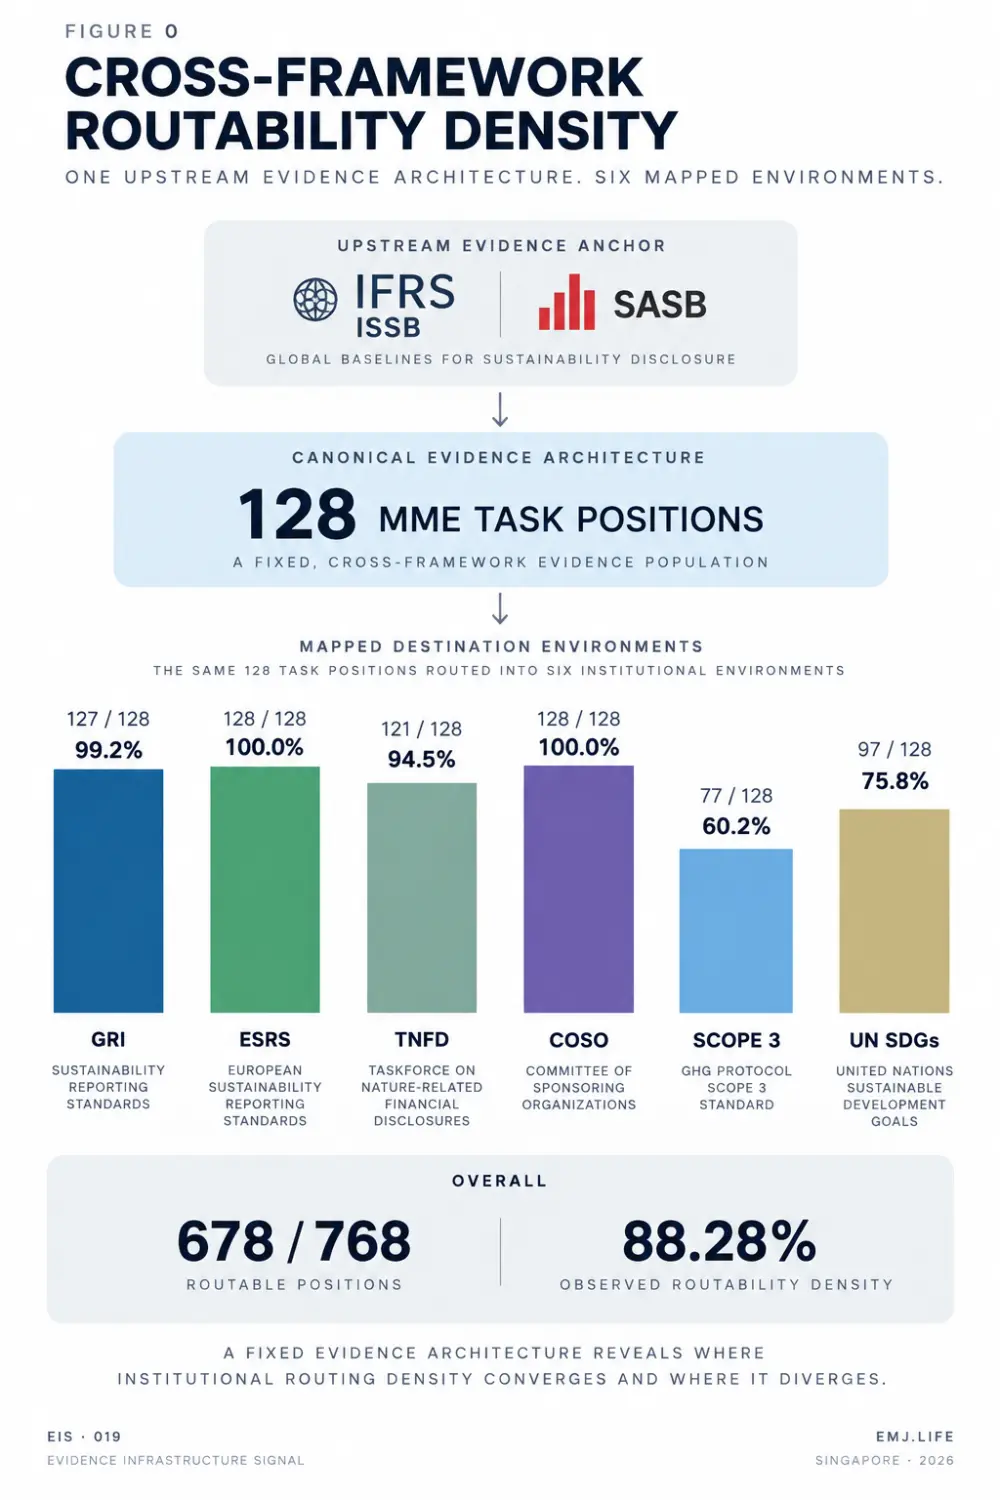
Because the upstream MME population remains fixed, differences between the six mapped environments become visible.
GRI 127 / 128 99.2%
ESRS 128 / 128 100.0%
TNFD 121 / 128 94.5%
COSO 128 / 128 100.0%
GHG Protocol Scope 3 77 / 128 60.2%
UN SDGs 97 / 128 75.8%
This variation matters.
The underlying task architecture has not changed.
What changed is the institutional destination against which the evidence relationship is being evaluated.
A lower density therefore does not automatically represent weaker interoperability.
It may indicate a narrower institutional purpose.
It may reflect stronger activation requirements.
It may require additional entity, activity, boundary or methodological information.
Or it may indicate that no defensible default relationship should be established.
This means routing density is partly a property of the institutional destination, not simply the evidence object.
A Shared Structural Direction
Institutional Signal
The Canonical Tasks Are Also Unevenly Portable
The corpus can also be examined from the opposite direction.
Instead of asking:
How many canonical tasks route into each destination environment?
we can ask:
How many destination environments can each canonical task enter?
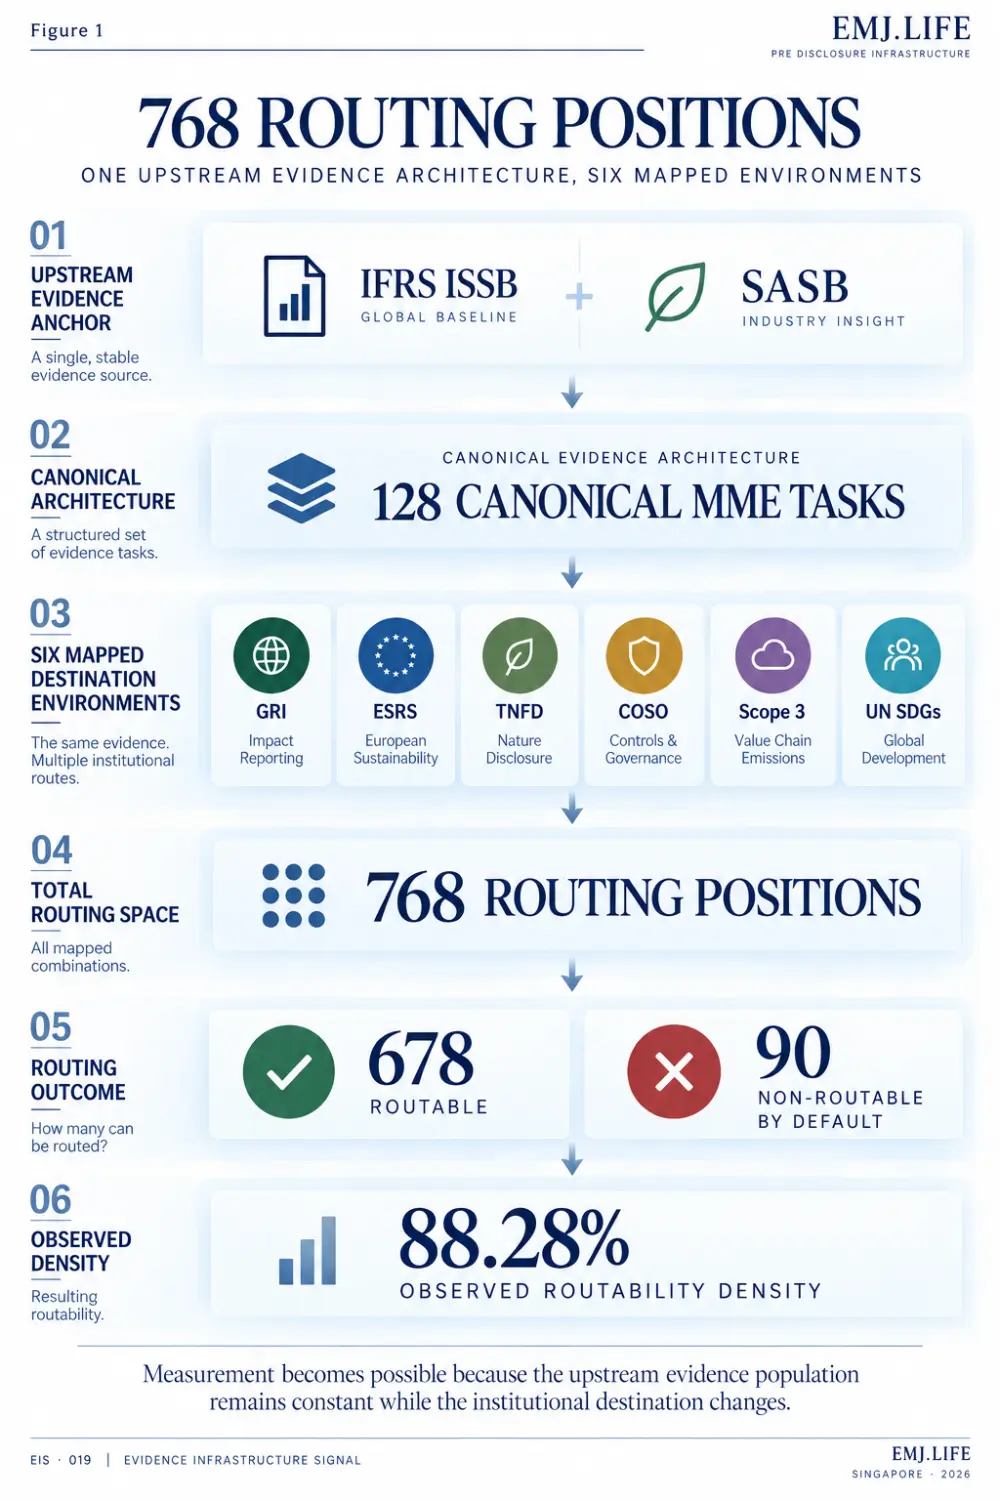
Of the 128 canonical MME tasks:
61 tasks are routable across all six environments.
46 tasks are routable across five.
19 tasks are routable across four.
2 tasks are routable across three.
This means:
107 of 128 tasks, or 83.59%, are routable across at least five of six destination environments.
At a threshold of at least four:
126 of 128 tasks, or 98.44%, remain routable.
This reveals another property of the architecture.
A substantial portion of the 128-task canonical evidence structure is not confined to a single destination framework.
The same upstream evidence-generating task may support several governed institutional relationships.
This can be described as:
Cross-Framework Task Portability
Task portability does not mean that the destination environments become equivalent.
It measures how broadly the same canonical evidence position can participate across governed institutional routes.
Pre-Disclosure Evidence Infrastructure Perspective
Evidence Infrastructure Perspective
The Remaining 90 Positions Are Part of the Measurement
The corpus contains:
90 POSITIONS
where no default route is preserved.
Evidence Infrastructure Analysis · 014 established the governance logic behind states such as NO-DEFAULT-ROUTE.
EIS · 019 does not repeat that governance analysis.
Its significance here is methodological.
Those 90 positions remain inside the denominator.
This prevents routability from being measured only through positive relationships.
If every canonical task were forced into every mapped environment, the result would be:
768 / 768
100%
But that number would only have meaning if all 768 relationships were defensible.
A higher percentage is therefore not automatically evidence of stronger interoperability.
The relevant property is:
Governed Connectivity
The architecture records both:
where a relationship exists
and
where one should not be created by default.
That is essential to interpreting the 88.28% result.
Emerging Measurement Layer
From Relationship Governance to Distributional Interoperability
EIA · 014 established why interoperability cannot be treated as a binary relationship.
Relationship type, strength, state and governance boundaries remain important.
EIS · 019 moves to a different analytical layer.
Once those governed relationships are represented across a stable upstream population, their distribution can be measured.
This publication describes that layer as:
Distributional Interoperability
Distributional Interoperability examines how governed evidence relationships are distributed when a fixed upstream evidence architecture is routed across multiple institutional environments.
In this analysis:
Fixed upstream architecture
IFRS ISSB + SASB anchored 128-task MME architecture
Variable institutional destinations
GRI · ESRS · TNFD · COSO · GHG Protocol Scope 3 · UN SDGs
This structure enables questions that ordinary mapping counts cannot answer.
Which canonical tasks travel most broadly?
Which institutional destinations produce lower routing density?
Where do non-routing positions cluster?
Which task categories repeatedly appear across different institutional environments?
Where does portability weaken?
And how do those distributions change when source frameworks or routing methodologies change?
These are no longer simply mapping questions.
They are infrastructure measurement questions.
Closing Reflection
Why Maximum Routability Is Not the Objective
The 88.28% result should not be interpreted as a target to increase automatically.
A future corpus showing 95% or 100% routability would not necessarily be better.
The correct question would be:
Are the additional relationships defensible?
A useful interoperability measure therefore needs to observe both:
relationship presence
and
relationship absence.
This is particularly important because the six destination environments serve different institutional purposes.
A canonical activity may be broadly relevant to GRI or ESRS while having no defensible default Scope 3 relationship.
That does not make the evidence architecture inconsistent.
It reflects different destination logic.
Interoperability therefore should not be optimized toward maximum connection density.
It should be optimized toward:
defensible relationship density.
The Next Research Question
Framework Routability Is Not ESG Activity Coverage
An important boundary remains.
The denominator in EIS · 019 is:
128 canonical MME tasks × six mapped destination environments
It is not:
the universe of human or institutional ESG activity.
Therefore:
88.28% ROUTABILITY
does not mean:
88.28% of global ESG activity is covered,
88.28% of sustainability requirements are equivalent,
88.28% of disclosures can be satisfied with identical evidence,
or an enterprise becomes 88.28% compliant.
A separate benchmark is required to answer the larger activity-coverage question.
That future research layer could construct an independent universe of recurring ESG activities and test whether each activity can be represented through the canonical architecture as:
Direct Coverage
Composite Coverage
or
Gap
Only then could another question be tested:
Can a finite canonical evidence architecture represent most recurring ESG activity without continually creating new task identities?
The six-guide corpus does not establish that result.
It creates a measurable basis from which the question can now be investigated.
Closing Signal
The most visible number in this Signal is:
88.28%
But the more important development is architectural.
A stable upstream evidence architecture now exists across six mapped destination environments.
The same:
128 canonical MME task positions, anchored in IFRS ISSB + SASB
can therefore be observed repeatedly without changing the underlying evidence population.
Across:
768 ROUTING POSITIONS
678 contain governed routes.
Across:
128 CANONICAL TASKS
83.59% are routable across at least five of six mapped environments.
At the same time:
90 positions preserve the absence of a default route.
Together, these results create something more useful than a large mapping count.
They create an observable relationship distribution.
The signal is therefore not:
Interoperability reached 88.28%.
It is:
Interoperability has become observable.
And once interoperability becomes observable against a stable evidence architecture, it can begin to be:
compared,
tested,
tracked,
and
governed
as an infrastructure property.
Source and Analytical Boundary
Methodological Boundary
This Signal is a full-census analysis of EMJ.LIFE's own published canonical mapping corpus.
It is not an independent third-party benchmark.
The upstream evidence architecture is the 128-task MME structure anchored in IFRS ISSB + SASB.
The comparative population consists of six mapped destination environments:
GRI
ESRS
TNFD
COSO
GHG Protocol Scope 3
and the United Nations Sustainable Development Goals.
The measured population is therefore:
128 canonical tasks × six mapped destination environments = 768 routing positions
The analysis measures:
cross-framework routability density
and
cross-framework task portability
within that defined population.
It does not establish:
regulatory equivalence,
compliance,
materiality,
assurance readiness,
disclosure completeness,
institutional endorsement,
or coverage of the global ESG activity universe.
Primary Publication Basis
Official issuing-institution materials remain authoritative for their respective standards, frameworks, methodologies, requirements and terminology.
The mappings are independent EMJ.LIFE methodology publications.
They do not constitute official crosswalks, regulatory determinations, compliance conclusions, certifications, assurance opinions or endorsements by the referenced institutions.
Publication record
Controlled publication record: Evidence Infrastructure Signal 019 is published and maintained on Sustainability News Network on 11 September 2026.
This canonical edition preserves the complete publication, controlled cover, three controlled figures, six DOI publication-basis records, rights metadata and analytical disclosure on one onsite reading page.
Sources informing this publication
EMJ LIFE HOLDINGS PTE. LTD.
Primary publication basis · Controlled DOI research publication · source-link-only · AI training not-allowed · related_institutional_sourceOpen official source ↗EMJ LIFE HOLDINGS PTE. LTD.
Primary publication basis · Controlled DOI research publication · source-link-only · AI training not-allowed · related_institutional_sourceOpen official source ↗EMJ LIFE HOLDINGS PTE. LTD.
Primary publication basis · Controlled DOI research publication · source-link-only · AI training not-allowed · related_institutional_sourceOpen official source ↗EMJ LIFE HOLDINGS PTE. LTD.
Primary publication basis · Controlled DOI research publication · source-link-only · AI training not-allowed · related_institutional_sourceOpen official source ↗EMJ LIFE HOLDINGS PTE. LTD.
Primary publication basis · Controlled DOI research publication · source-link-only · AI training not-allowed · related_institutional_sourceOpen official source ↗EMJ LIFE HOLDINGS PTE. LTD.
Primary publication basis · Controlled DOI research publication · source-link-only · AI training not-allowed · related_institutional_sourceOpen official source ↗Evidence Infrastructure terminology and conclusions are separately governed SNN editorial interpretations. They do not imply participation, endorsement, validation or adopted positions by the institutions cited above.
This Signal is a full-census analysis of EMJ.LIFE's own published canonical mapping corpus. It is not an independent third-party benchmark. The analysis measures cross-framework routability density and task portability within 768 defined routing positions. It does not establish regulatory equivalence, compliance, materiality, assurance readiness, disclosure completeness, institutional endorsement or coverage of the global ESG activity universe.